
Flagship
Ops Signal Studio
Eight weeks of application analytics for microcloud operations health: golden signals, quiet baselines, and review rituals that survive on-call weeks.
Application analytics · Operations health
We teach teams to read microcloud telemetry like a morning pulse — gentle, precise, and useful before the day gets loud.
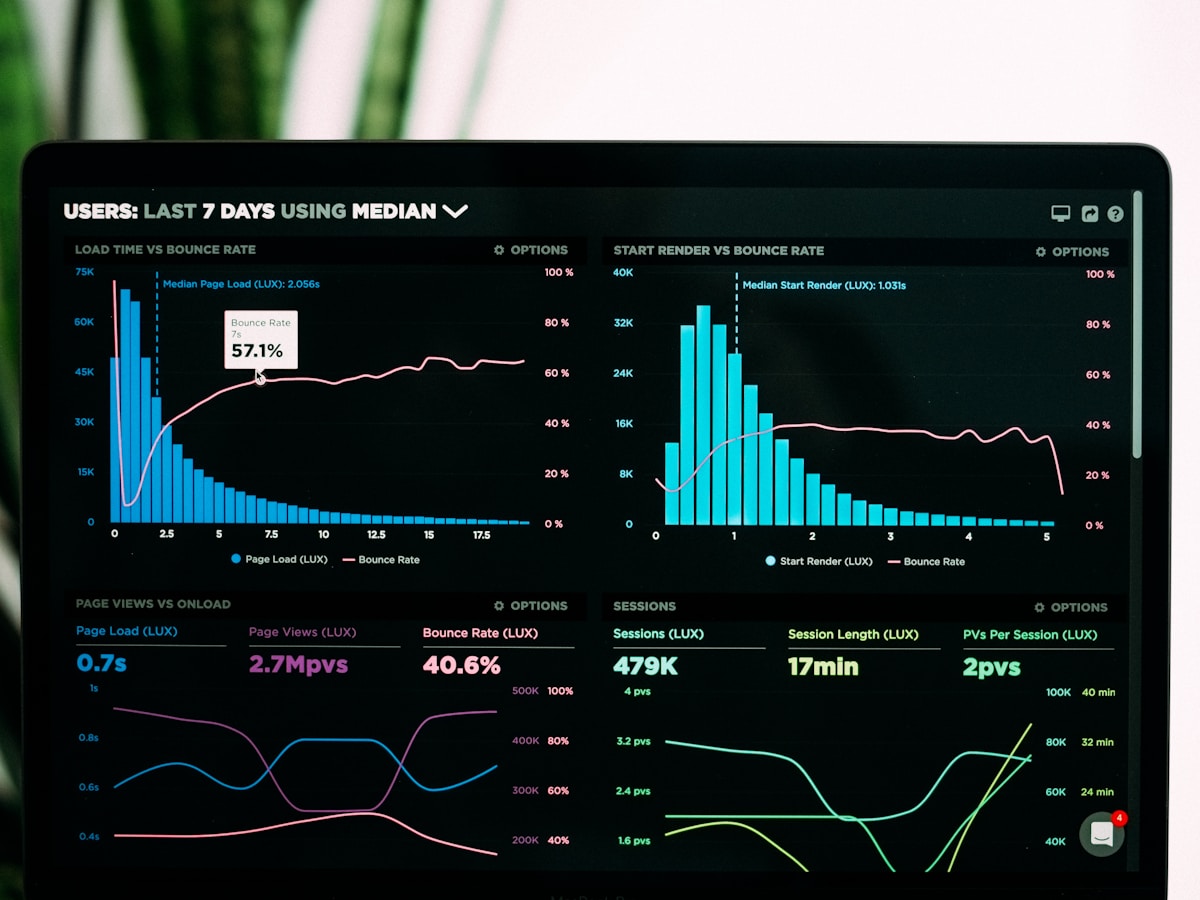
Start with the studio most teams choose when dashboards feel decorative instead of decisive.
Eight weeks of application analytics for microcloud operations health: golden signals, quiet baselines, and review rituals that survive on-call weeks.
Practical habits, not slide decks that age out after a tooling change.
Translate latency, errors, and saturation into stories your product partners can follow without jargon fog.
Weekly health checks that fit a microcloud footprint instead of copying hyperscale playbooks wholesale.
We teach when metrics lie — cold starts, noisy neighbors, and sampling that flatters the graph.
Live office hours and async studios that respect KST calendars and cross-border collaboration patterns.
Specific notes from people who finished Ops Signal Studio and neighboring modules.
“The baseline module stopped us from chasing a ‘perfect’ p99 that only existed during quiet lunch hours in Seoul.”
“I still wish the sampling lab had one more dataset for multi-region failover, but the error-budget worksheet alone paid for the seat.”
“★★★★☆ — Clear, unhurried, and useful on Monday morning.”
Short essays on reading application health without turning every spike into a ceremony.

Why treating response time like a pulse helps microcloud teams avoid cosmetic dashboards.

A fifteen-minute ritual that fits before stand-up without becoming another status theater.

How release windows, cache warmers, and traffic shape hide inside ‘healthy’ green panels.
Tell us about your stack and we will suggest a learning path — no checkout pressure, just a clear next step.